
As summer arrives, millions of Americans face a crucial fitness dilemma: where can you maintain consistent outdoor workouts without battling dangerous heat, oppressive humidity, or poor air quality? While gym memberships spike in winter, the desire to exercise outdoors reaches its peak during summer months, but not all cities are created equal when it comes to workout-friendly conditions.
The surprising winner? San Francisco, California dominates our comprehensive analysis, while Orlando, Florida struggles at the bottom of our rankings.
But the most striking finding is the clear geographic divide: Pacific Northwest and Northern California cities claim 8 of the top 10 spots, creating a “Workout Paradise Corridor” along the West Coast.
The Winners and Losers: A Tale of Two Americas
America’s Top 10 Summer Workout Cities
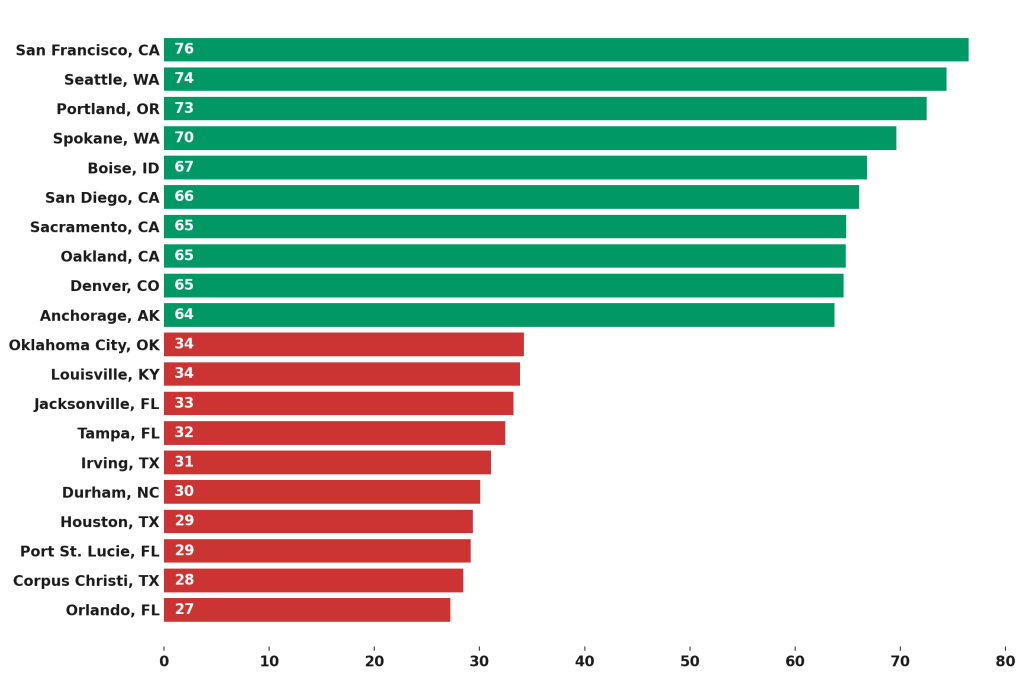
The cities that scored highest combine the perfect storm of comfortable temperatures, minimal rainfall, excellent parks, and clean air:
- San Francisco, CA (Score: 76/100)
- Seattle, WA (Score: 74/100)
- Portland, OR (Score: 73/100)
- Spokane, WA (Score: 70/100)
- Boise, ID (Score: 67/100)
- San Diego, CA (Score: 66/100)
- Sacramento, CA (Score: 65/100)
- Oakland, CA (Score: 65/100)
- Denver, CO (Score: 65/100)
- Anchorage, AK (Score: 64/100)
America’s 10 Most Challenging Workout Cities
At the bottom of our rankings, Southern cities struggle with a punishing combination of extreme heat, crushing humidity, and frequent thunderstorms:
- Orlando, FL (Score: 27/100)
- Corpus Christi, TX (Score: 28/100)
- Port St. Lucie, FL (Score: 29/100)
- Houston, TX (Score: 29/100)
- Durham, NC (Score: 30/100)
- Irving, TX (Score: 31/100)
- Tampa, FL (Score: 32/100)
- Jacksonville, FL (Score: 33/100)
- Louisville, KY (Score: 34/100)
- Oklahoma City, OK (Score: 34/100)
Explore the Complete Rankings
Find Your City: Use our interactive map above to discover how your city ranks and see the detailed breakdown of factors that contributed to its score. The map reveals clear geographic patterns – notice how West Coast cities cluster in the top tiers while Southern cities concentrate in the lower ranges.
Dive Deeper: The complete rankings table below allows you to search, sort, and compare all cities across every factor we measured:
| Rank | City | Avg High Temp | Avg Humidity | AQI score | Avg. Rainfall (inches) | UV Index | Parkscore | Best City Score |
|---|---|---|---|---|---|---|---|---|
| 1 | San Francisco, CA | 71 | 76% | 23.00 | 0.09 | 9.00 | 6 | 76 |
| 2 | Seattle, WA | 76 | 69% | 35.00 | 0.93 | 8.00 | 8 | 74 |
| 3 | Portland, OR | 83 | 61% | 21.00 | 1.00 | 8.00 | 9 | 73 |
| 4 | Spokane, WA | 85 | 38% | 37.00 | 0.82 | 9.00 | 33 | 70 |
| 5 | Boise, ID | 92 | 29% | 51.00 | 0.38 | 9.00 | 20 | 67 |
| 6 | San Diego, CA | 76 | 77% | 56.00 | 0.07 | 10.00 | 22 | 66 |
| 7 | Sacramento, CA | 94 | 43% | 17.00 | 0.09 | 9.00 | 32 | 65 |
| 8 | Oakland, CA | 74 | 76% | 47.00 | 0.06 | 9.00 | 44 | 65 |
| 9 | Denver, CO | 91 | 41% | 38.00 | 1.94 | 11.00 | 10 | 65 |
| 10 | Anchorage, AK | 64 | 78% | 28.00 | 2.02 | 5.00 | 53 | 64 |
| 11 | Minneapolis, MN | 80 | 74% | 36.00 | 4.20 | 8.00 | 3 | 64 |
| 12 | Fremont, CA | 85 | 70% | 20.00 | 0.05 | 10.00 | 39 | 63 |
| 13 | St. Paul, MN | 80 | 73% | 36.00 | 4.46 | 8.00 | 5 | 63 |
| 14 | San Jose, CA | 85 | 56% | 42.00 | 0.03 | 10.00 | 42 | 63 |
| 15 | Boston, MA | 81 | 72% | 38.00 | 3.49 | 9.00 | 12 | 62 |
| 16 | Albuquerque, NM | 93 | 34% | 45.00 | 1.27 | 12.00 | 24 | 61 |
| 17 | Milwaukee, WI | 80 | 72% | 41.00 | 3.84 | 9.00 | 18 | 61 |
| 18 | Riverside, CA | 73 | 53% | 63.00 | 0.07 | 10.00 | 81 | 61 |
| 19 | Aurora, CO | 91 | 38% | 38.00 | 1.94 | 9.00 | 49 | 59 |
| 20 | Buffalo, NY | 81 | 77% | 44.00 | 3.38 | 8.00 | 23 | 59 |
| 21 | Chicago, IL | 84 | 71% | 47.00 | 3.53 | 9.00 | 11 | 58 |
| 22 | Colorado Springs, CO | 87 | 44% | 29.00 | 2.89 | 12.00 | 52 | 58 |
| 23 | Honolulu, HI | 88 | 72% | 17.00 | 0.46 | 13.00 | 38 | 58 |
| 24 | Cincinnati, OH | 86 | 67% | 48.00 | 4.00 | 9.00 | 4 | 58 |
| 25 | Madison, WI | 81 | 74% | 43.00 | 4.33 | 9.00 | 19 | 58 |
| 26 | Reno, NV | 94 | 26% | 24.00 | 0.30 | 10.00 | 85 | 57 |
| 27 | Henderson, NV | 108 | 15% | 37.00 | 0.35 | 11.00 | 25 | 57 |
| 28 | Santa Clarita, CA | 87 | 43% | 58.00 | 0.07 | 10.00 | 63 | 57 |
| 29 | Omaha, NE | 86 | 67% | 14.00 | 3.94 | 10.00 | 41 | 56 |
| 30 | New York, NY | 84 | 70% | 59.00 | 4.05 | 9.00 | 13 | 55 |
| 31 | Los Angeles, CA | 74 | 67% | 63.00 | 0.06 | 10.00 | 90 | 55 |
| 32 | Pittsburgh, PA | 85 | 71% | 58.00 | 3.73 | 9.00 | 15 | 55 |
| 33 | Long Beach, CA | 82 | 78% | 48.00 | 0.04 | 10.00 | 56 | 55 |
| 34 | Lincoln, NE | 88 | 64% | 31.00 | 3.75 | 10.00 | 29 | 55 |
| 35 | Washington, D.C. | 90 | 70% | 58.00 | 3.45 | 9.00 | 1 | 54 |
| 36 | Las Vegas, NV | 108 | 14% | 37.00 | 0.35 | 11.00 | 47 | 53 |
| 37 | Cleveland, OH | 83 | 77% | 50.00 | 3.47 | 9.00 | 30 | 53 |
| 38 | Chula Vista, CA | 76 | 77% | 60.00 | 0.04 | 10.00 | 84 | 53 |
| 39 | Kansas City, MO | 86 | 69% | 52.00 | 3.85 | 10.00 | 27 | 52 |
| 40 | Arlington, VA | 90 | 70% | 58.00 | 3.45 | 11.00 | 7 | 51 |
| 41 | Philadelphia, PA | 87 | 65% | 55.00 | 4.07 | 9.00 | 28 | 51 |
| 42 | Jersey City, NJ | 88 | 70% | 46.00 | 3.90 | 9.00 | 31 | 51 |
| 43 | Detroit, MI | 82 | 71% | 55.00 | 2.84 | 8.00 | 58 | 51 |
| 44 | Toledo, OH | 84 | 68% | 50.00 | 3.30 | 9.00 | 51 | 51 |
| 45 | Stockton, CA | 97 | 41% | 35.00 | 0.04 | 9.00 | 80 | 50 |
| 46 | North Las Vegas, NV | 108 | 15% | 37.00 | 0.35 | 11.00 | 61 | 50 |
| 47 | Richmond, VA | 89 | 70% | 54.00 | 4.33 | 10.00 | 16 | 49 |
| 48 | St. Louis, MO | 89 | 70% | 62.00 | 3.66 | 10.00 | 26 | 48 |
| 49 | Plano, TX | 96 | 63% | 58.00 | 2.89 | 11.00 | 17 | 47 |
| 50 | Chesapeake, VA | 85 | 78% | 55.00 | 4.97 | 10.00 | 36 | 46 |
| 51 | Atlanta, GA | 91 | 66% | 69.00 | 4.37 | 10.00 | 21 | 45 |
| 52 | El Paso, TX | 100 | 30% | 56.00 | 1.24 | 13.00 | 65 | 45 |
| 53 | Fresno, CA | 100 | 26% | 50.00 | 0.10 | 10.00 | 98 | 45 |
| 54 | Scottsdale, AZ | 110 | 25% | 60.00 | 0.72 | 11.00 | 48 | 45 |
| 55 | Newark, NJ | 88 | 69% | 46.00 | 4.16 | 9.00 | 62 | 44 |
| 56 | Dallas, TX | 96 | 62% | 58.00 | 2.89 | 11.00 | 34 | 44 |
| 57 | Frisco, TX | 96 | 61% | 58.00 | 2.89 | 11.00 | 37 | 44 |
| 58 | Norfolk, VA | 85 | 77% | 55.00 | 4.97 | 10.00 | 50 | 43 |
| 59 | Lexington, KY | 88 | 70% | 42.00 | 4.11 | 9.00 | 68 | 43 |
| 60 | Arlington, TX | 96 | 61% | 58.00 | 2.89 | 11.00 | 46 | 42 |
| 61 | Tucson, AZ | 103 | 34% | 45.00 | 1.49 | 13.00 | 71 | 41 |
| 62 | Virginia Beach, VA | 85 | 79% | 55.00 | 4.97 | 10.00 | 60 | 40 |
| 63 | Lubbock, TX | 96 | 42% | 45.00 | 2.34 | 12.00 | 94 | 40 |
| 64 | Tulsa, OK | 93 | 65% | 58.00 | 3.77 | 11.00 | 59 | 39 |
| 65 | Austin, TX | 96 | 68% | 57.00 | 2.59 | 11.00 | 54 | 39 |
| 66 | St. Petersburg, FL | 92 | 78% | 52.00 | 7.34 | 12.00 | 14 | 39 |
| 67 | Wichita, KS | 92 | 63% | 53.00 | 3.94 | 10.00 | 75 | 39 |
| 68 | Raleigh, NC | 91 | 73% | 58.00 | 4.12 | 10.00 | 55 | 39 |
| 69 | Gilbert, AZ | 110 | 36% | 63.00 | 0.72 | 11.00 | 77 | 38 |
| 70 | Greensboro, NC | 87 | 70% | 57.00 | 4.03 | 10.00 | 86 | 38 |
| 71 | Fort Worth, TX | 96 | 58% | 58.00 | 2.89 | 11.00 | 72 | 37 |
| 72 | Phoenix, AZ | 110 | 25% | 60.00 | 0.72 | 11.00 | 83 | 37 |
| 73 | Glendale, AZ | 110 | 25% | 60.00 | 0.72 | 10.00 | 89 | 37 |
| 74 | Garland, TX | 96 | 64% | 58.00 | 2.89 | 11.00 | 67 | 37 |
| 75 | Nashville, TN | 92 | 72% | 56.00 | 3.65 | 9.00 | 74 | 36 |
| 76 | Winston-Salem, NC | 87 | 68% | 57.00 | 4.69 | 10.00 | 88 | 36 |
| 77 | New Orleans, LA | 93 | 77% | 56.00 | 5.01 | 11.00 | 45 | 36 |
| 78 | San Antonio, TX | 97 | 65% | 59.00 | 3.05 | 12.00 | 57 | 36 |
| 79 | Mesa, AZ | 110 | 25% | 63.00 | 0.72 | 11.00 | 87 | 36 |
| 80 | Miami, FL | 91 | 79% | 54.00 | 7.04 | 11.00 | 35 | 36 |
| 81 | Memphis, TN | 91 | 71% | 74.00 | 3.53 | 10.00 | 70 | 35 |
| 82 | Charlotte, NC | 90 | 68% | 59.00 | 3.88 | 9.00 | 91 | 35 |
| 83 | Chandler, AZ | 110 | 26% | 63.00 | 0.72 | 11.00 | 93 | 34 |
| 84 | Oklahoma City, OK | 92 | 59% | 60.00 | 3.34 | 11.00 | 95 | 34 |
| 85 | Louisville, KY | 89 | 72% | 54.00 | 3.78 | 10.00 | 96 | 34 |
| 86 | Jacksonville, FL | 93 | 78% | 41.00 | 5.72 | 11.00 | 64 | 33 |
| 87 | Tampa, FL | 92 | 77% | 57.00 | 7.34 | 12.00 | 43 | 32 |
| 88 | Irving, TX | 96 | 61% | 58.00 | 2.89 | 11.00 | 99 | 31 |
| 89 | Durham, NC | 91 | 74% | 57.00 | 4.11 | 10.00 | 97 | 30 |
| 90 | Houston, TX | 94 | 80% | 66.00 | 4.71 | 10.00 | 66 | 29 |
| 91 | Port St. Lucie, FL | 91 | 80% | 46.00 | 6.57 | 12.00 | 73 | 29 |
| 92 | Corpus Christi, TX | 95 | 79% | 63.00 | 3.35 | 12.00 | 78 | 28 |
| 93 | Orlando, FL | 93 | 82% | 32.00 | 7.89 | 12.00 | 69 | 27 |
Key Insights: What the Data Reveals
The Pacific Northwest Advantage
Cities like Seattle and Portland excel due to a unique combination of mild summer temperatures (typically 65-75°F), minimal rainfall during summer months, and exceptional park infrastructure. Seattle’s 65 park score and Portland’s 67 park score reflect decades of investment in green spaces and outdoor recreation facilities.
The “Comfort Zone” Discovery
Our analysis reveals that the ideal outdoor workout temperature isn’t the hottest or coldest – it’s the “Goldilocks zone” between 65-75°F. Cities in this range scored consistently higher than both hotter and cooler alternatives, challenging the assumption that sunny equals better for outdoor exercise.
The Peak Temperature Reality
Our analysis focuses on average daily high temperatures – the conditions you’ll actually face during most outdoor workouts. While some cities may have pleasant average temperatures, it’s the peak heat that determines whether your afternoon run will be comfortable or dangerous. This methodology provides a more realistic assessment of workout conditions than studies using daily averages.
The Sun Belt Struggle
Texas and Florida cities dominate the bottom rankings due to a triple threat: temperatures regularly exceeding 85°F, humidity levels above 70%, and afternoon thunderstorms that disrupt outdoor activities. Orlando’s combination of 84°F average temperature and 75% humidity creates heat index values that make extended outdoor exercise potentially dangerous.
The Surprise Mountain West Success
Denver and Boise demonstrate that elevation and geography can overcome challenging climates. Despite intense UV exposure at altitude, Denver’s low humidity (52%) and excellent park access (60 park score) propel it into the top 10.
The Air Quality Factor
Cities with excellent weather but poor air quality see their rankings suffer. While temperature and rainfall matter most, the ability to breathe clean air during extended cardiovascular activity proves crucial for the overall workout experience.
Making the Most of Your Summer Fitness
For Residents of Top-Ranked Cities
If you live in one of our top 20 cities, you’ve won the geographical lottery. Take advantage of your favorable conditions with these outdoor workout strategies:
- Early morning routines to capitalize on the coolest, most pleasant hours
- Park exploration to maximize your city’s green space investments
- Seasonal training cycles that emphasize outdoor work during your peak months
For Everyone Else: The Hybrid Approach
For the majority of Americans living in challenging summer climates, a hybrid fitness strategy becomes essential. While our top-ranked cities enjoy 4-5 months of ideal outdoor conditions, most cities experience only 2-3 months of truly comfortable workout weather.
The solution isn’t giving up outdoor exercise – it’s having a reliable backup plan.
This is where a well-equipped home gym becomes invaluable. When heat indices soar above 90°F, air quality alerts are issued, or afternoon thunderstorms roll in, having quality equipment at home ensures you never miss a workout. A basic setup with adjustable dumbbells, a quality treadmill, or a functional trainer can bridge the gap between your city’s challenging climate and your fitness goals.
Our Methodology: How We Ranked America’s Cities
The 2025 Summer Workout Index evaluated 90+ major U.S. cities across six critical factors that impact outdoor exercise quality and safety.
Our methodology prioritizes the complete workout experience rather than single metrics.
Factors and Weighting
- Temperature Comfort Zone (30%): Average daily high temperatures during summer months (June-August). Cities scored best when summer highs fell between 65-75°F – the optimal range for sustained outdoor exercise.
- Humidity Levels (20%): Average relative humidity during peak summer months. Lower humidity improves comfort and reduces heat stress during extended outdoor activity.
- Park Quality & Access (20%): Based on Trust for Public Land ParkScore methodology measuring park access, acreage, and amenities available for outdoor fitness activities.
- Summer Rainfall (15%): Average precipitation during peak workout months (June-August). Lower rainfall scored higher as dry conditions enable consistent outdoor exercise.
- Air Quality Index (10%): EPA-measured air quality using standard pollutant monitoring. Clean air is essential for safe cardiovascular exercise and respiratory health.
- UV Index (5%): Solar radiation intensity during summer months. Lower UV exposure reduces skin cancer risk and heat stress during extended outdoor workouts.
Data Sources
- Daily High Temperatures: National Oceanic and Atmospheric Administration (NOAA)
- Humidity: Open-Meteo historical weather API
- Park Scores: Trust for Public Land ParkScore Index
- Rainfall: U.S. Climate Data historical averages
- Air Quality: EPA AirNow monitoring network
- UV Index: OpenWeatherMap API
Scoring Methodology
Each factor was normalized to a 0-100 scale using min-max normalization. The final Summer Workout Index score represents a weighted average of all factors, with higher scores indicating better conditions for outdoor exercise.
Limitations: Scores represent city-wide averages and may not reflect neighborhood-level variations. Individual fitness levels, health conditions, and personal heat tolerance affect workout suitability beyond these environmental factors.
